Tips
Sales Reports answer such questions as "What are our bestsellers?", "What menu items do I need to discontinue?", and "What did I sell the most of last year?".
Sales Reports show you how profitable and popular each dish you sell. Remember, Sales is the final step, transforming your Inventory Items via Recipes to dishes that your customers eat. Sales Reports pull all of this information together showing how well this process went.
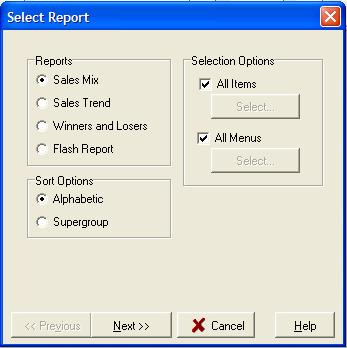
To access Sales Reports, click Sales, click Reports.
You can choose certain Recipes or Saleable items for details. To use the selection command, uncheck the box next to All Items. Click Select and then choose your menu items. Make sure check the box next to each item you want to include. When you finish, click OK.
You can also choose to focus on certain
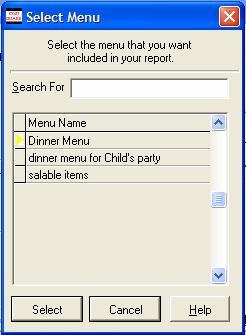
menus. To use this selection command, uncheck the box next All Menus.
Another popup will appear. Move the cursor so that the ![]() is to the left of the menu that you want to analyze.
This option will allow you to run reports on lunch menus and dinner
menu separately. This option is available for the Sales Mix
and Winners and Losers Reports.
is to the left of the menu that you want to analyze.
This option will allow you to run reports on lunch menus and dinner
menu separately. This option is available for the Sales Mix
and Winners and Losers Reports.
You can sort Sales Reports. Use your mouse to move to the Sort Options box. You can click the button next to Alphabetic or SuperGroup depending on your needs.
After you choose a report, click Next.
Then a date screen will appear. You must enter in the dates for
the reports to work You can click one of the preset buttons for
the reporting period. The default setting is the Custom button,
which will activate the bottom Date Range fields. CostGuard uses
the chosen dates as brackets to calculate the sales reports. To enter
in the dates, you can type in the date or click the ![]() at
the end of the date line. The date popup will appear. Today’s
date is blue with a red circle around it. If you want today, then
click the circle to enter it. To choose another date in this month,
then move your cursor to that date and click on it. To go to a previous
month, click
at
the end of the date line. The date popup will appear. Today’s
date is blue with a red circle around it. If you want today, then
click the circle to enter it. To choose another date in this month,
then move your cursor to that date and click on it. To go to a previous
month, click ![]() button. Keep clicking this button
until you get to the month that you want. Today’s date, or if you highlighted
another date will still be blue in that previous month. Because
of the nature of this report, you should not enter in a date that is in
the future. The reports will not work. When you are finished
entering in the dates, click Next to see the report.
button. Keep clicking this button
until you get to the month that you want. Today’s date, or if you highlighted
another date will still be blue in that previous month. Because
of the nature of this report, you should not enter in a date that is in
the future. The reports will not work. When you are finished
entering in the dates, click Next to see the report.
The Sales Module has the following Reports:
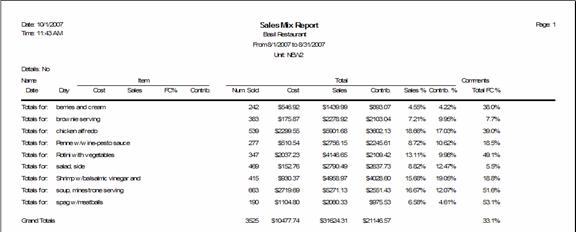
This Report shows all items in your menu divided into two columns: Item on the left and Total on the right. The Item side includes number sold, cost, menu price, and food cost percentage. The Total Side of the report, takes the information in the Item side and multiplies it by the number of this item sold. Sold % is number of this item sold divided by the grand total of all items sold. Contribution Margin % is Item contribution margin in dollars divided by the total of all the contribution margin dollars. This column highlights your most profitable items. The grand total on the last page of this report shows your theoretical food cost for the period. This report answers such questions as “what have we sold the most of, this quarter?” and “how much did we spend to make that dish last year?” The sample shown below had the detail box unchecked.
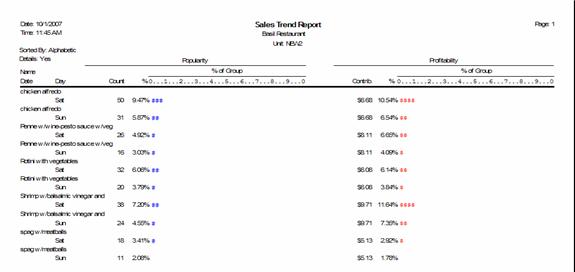
This Report shows each menu item popularity and profitability graphically. It compares each item to others within their recipe group. Use this report to find your most popular and profitable items within a menu category, for example, if you want to compare all of your entrées. The sample report below shows one night’s sales of entrées.
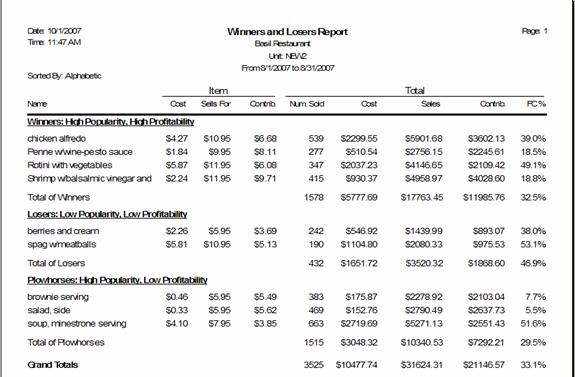
This is the report that shows your Winners, Plowhorses, Puzzles, and Losers. It tells you which menu items you should keep, tweak, or get rid of. CostGuard uses menu-engineering formulas, creating a report to help grow your business. If you would like more information on how to use this report, click here.
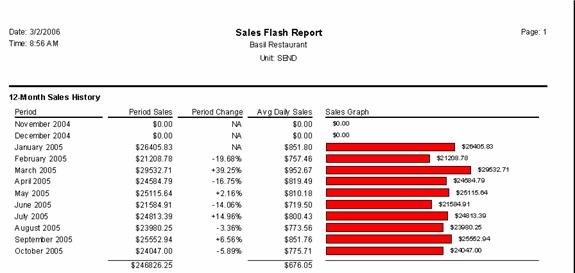
The flash report gives you a quick overview of your sales. This Report answers the question “How am I doing?” Use it to review your overall sales for the year.
This is the last stop
for the  Quick Tour. You can continue
on the regular
path to How to get the most out of Coastguard.
Quick Tour. You can continue
on the regular
path to How to get the most out of Coastguard.