 Sales Reports Sales Reports
 Sales Reports show you how profitable and popular each dish you sell. Remember, Sales is the final step, transforming your Inventory Items via Recipes to dishes that your customers eat. Sales Reports pull all of this information together showing how well this process went.
To access Sales Reports, click Sales, click Reports.

You can choose certain Recipes or Saleable items for details. To use the selection command, uncheck the box next to All Items. Click Select and then choose your menu items. Make sure check the box next to each item you want to include. When you finish, click OK.
You can sort Sales Reports. Use your mouse to move to the Sort Options box. You can click the button next to Alphabetic or SuperGroup depending on your needs.
The Sales Module has the following Reports:
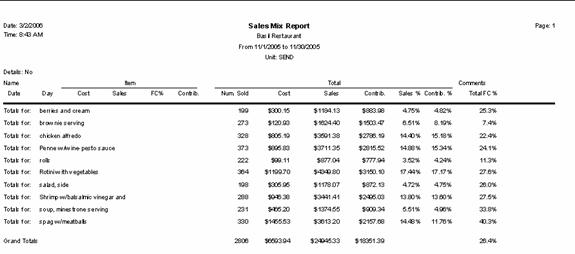
Sales Mix Report
This Report shows all items in your menu divided into two columns: Item on the left and Total on the right. The Item side includes number sold, cost, menu price, and food cost percentage. The Total Side of the report, takes the information in the Item side and multiplies it by the number of this item sold. Sold % is number of this item sold divided by the grand total of all items sold. Contribution Margin % is Item contribution margin in dollars divided by the total of all the contribution margin dollars. This column highlights your most profitable items. The grand total on the last page of this report shows your theoretical food cost for the period. This report answers such questions as “what have we sold the most of, this quarter?” and “how much did we spend to make that dish last year?” The sample shown below had the detail box unchecked.
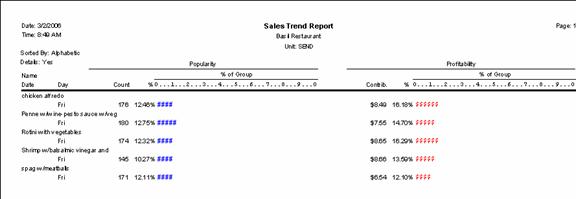
Sales Trend Report
This Report shows each menu item popularity and profitablity graphically. It compares each item to others within their recipe group. Use this report to find your most popular and profitable items within a menu category, for example, if you want to compare all of your entrées. The sample report below shows one night’s sales of entrées.
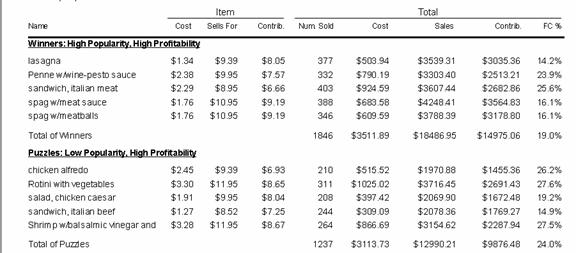
Winners and Losers Report
This is the report that shows your Winners, Plowhorses, Puzzles, and Losers. It tells you which menu items you should keep, tweek, or get rid of. CostGuard uses menu-engineering formulas, creating a report to help grow your business. If you would like more information on how to use this report, click here.
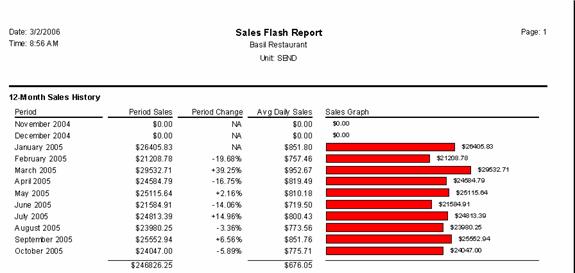
Flash Report
The flash report gives you a quick overview of your sales. This Report answers the question “How am I doing?” Use it to review your overall sales for the year.